As developers, we constantly strive to unlock the potential of our applications and deliver seamless performance to our users. In this blog, we will dive deep into Xcode Instruments and its suite of performance profiling and debugging tools to help achieve that. With a special focus on three essential instruments – Time Profiler, Allocations Instrument, and Zombies Instrument – you will gain insights that will not only help you optimize your apps for better performance but also fix crashes and memory-related issues effectively. Let’s get started!
Introduction to Xcode Instruments
Xcode Instruments provides deep insights into critical aspects like CPU resource utilization, memory management, and code execution. With this information, we can fine-tune our apps, eliminate bottlenecks, and fix memory-related issues and crashes.
Launch Xcode Instruments
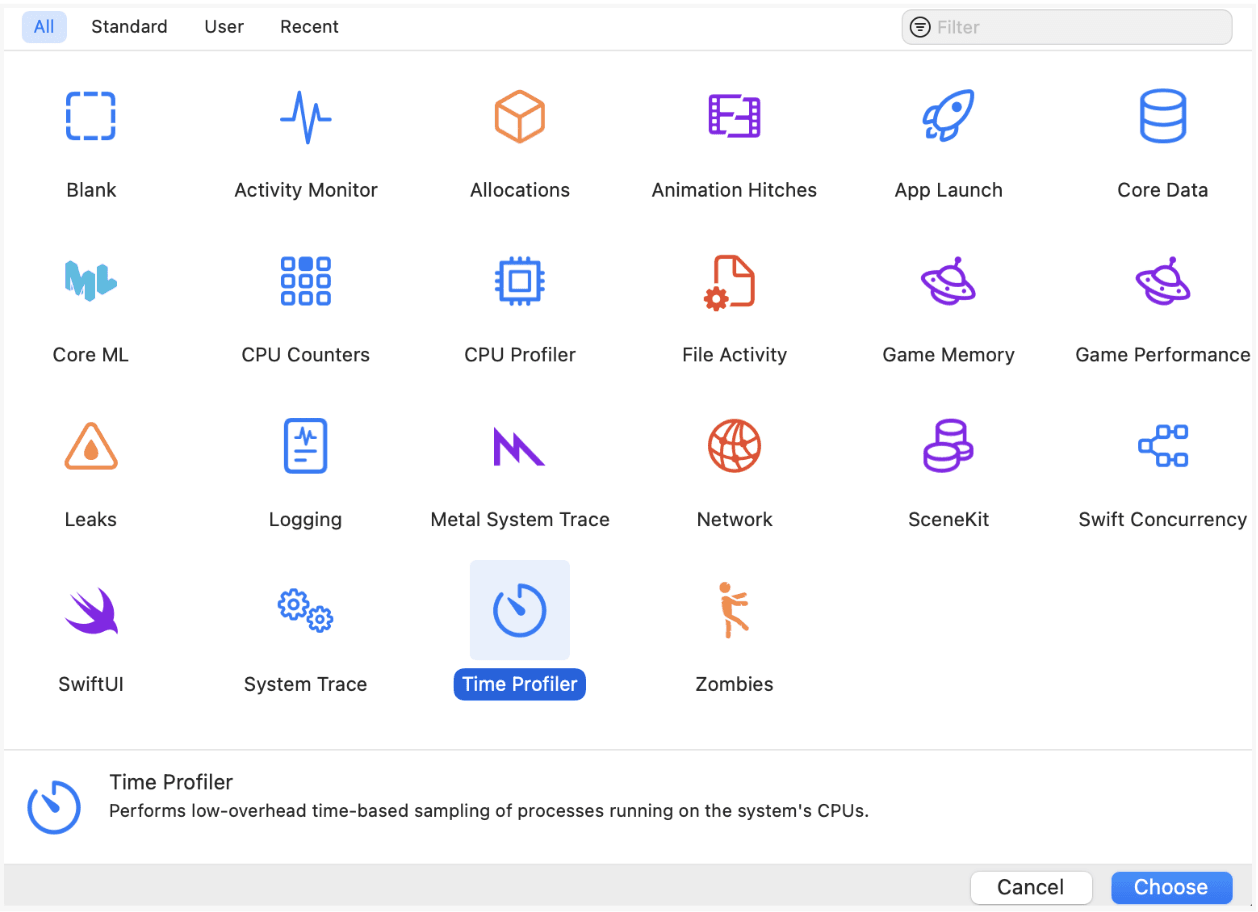
To launch Xcode Instruments head to Xcode’s menu bar, select Product ▸ Profile or press Command + I. This builds the app and launches Instruments. Choose the desired template from the Instruments window to start profiling or debugging.
Importance of Profiling and Debugging Tools
Profiling helps us understand how our application behaves under different scenarios, pinpoint areas of inefficiency, and optimize performance. Meanwhile, debugging tools enable us to track down and resolve bugs and issues in our code.
Optimizing app performance is not a luxury – it's a necessity. In today's competitive app landscape, users expect apps that run smoothly, respond swiftly, and consume minimal resources. By using Xcode Instruments, we can address performance issues, ensuring our apps meet and exceed these user expectations.
Excited to dive into the first instrument – the Time Profiler? Let's explore its role in profiling application performance and uncover insights that will take our apps to new heights!
Time Profiler Instrument - let’s remove performance bottlenecks
Understanding Time Profiler's Role in Profiling Application Performance
The Time Profiler Instrument is a powerful tool that shines a light on how an app spends its time executing code. By tracking CPU usage and measuring the execution time of functions and methods, this instrument provides crucial insights into an app's performance.
Analyzing Time Profiler Data to Identify Performance Bottlenecks
To start analyzing the Time Profiler Data, click on the record button. We can interact with our app as usual while the instrument quietly records performance data in the background. After the profiling session, the collected data is presented in an easy-to-understand format.
By visualizing the data in a timeline, we can see the duration and frequency of functions and methods, making it easy to pinpoint performance bottlenecks and identify areas of code that need optimization.
Code Example Demonstrating Time Profiler Usage
Now, let's take a look at a code example that performs array manipulation and how we can use the Time Profiler Instrument to optimize it for better performance.
func modifyArray() {
    // Calling performArrayManipulation method on the main thread
    let modifiedNumbers = self.performArrayManipulation()
    DispatchQueue.main.async {
        self.modifiedArrayTextView.text = modifiedNumbers.description
    }
}

func performArrayManipulation() -> [Int] {
    // Simulate a computationally intensive task
    var sum = 0
    for _ in 1...100000000 {
        sum += 1
    }

    let modifiedNumbers = numbers.filter { $0 % 2 != 0 }
    return modifiedNumbers
}
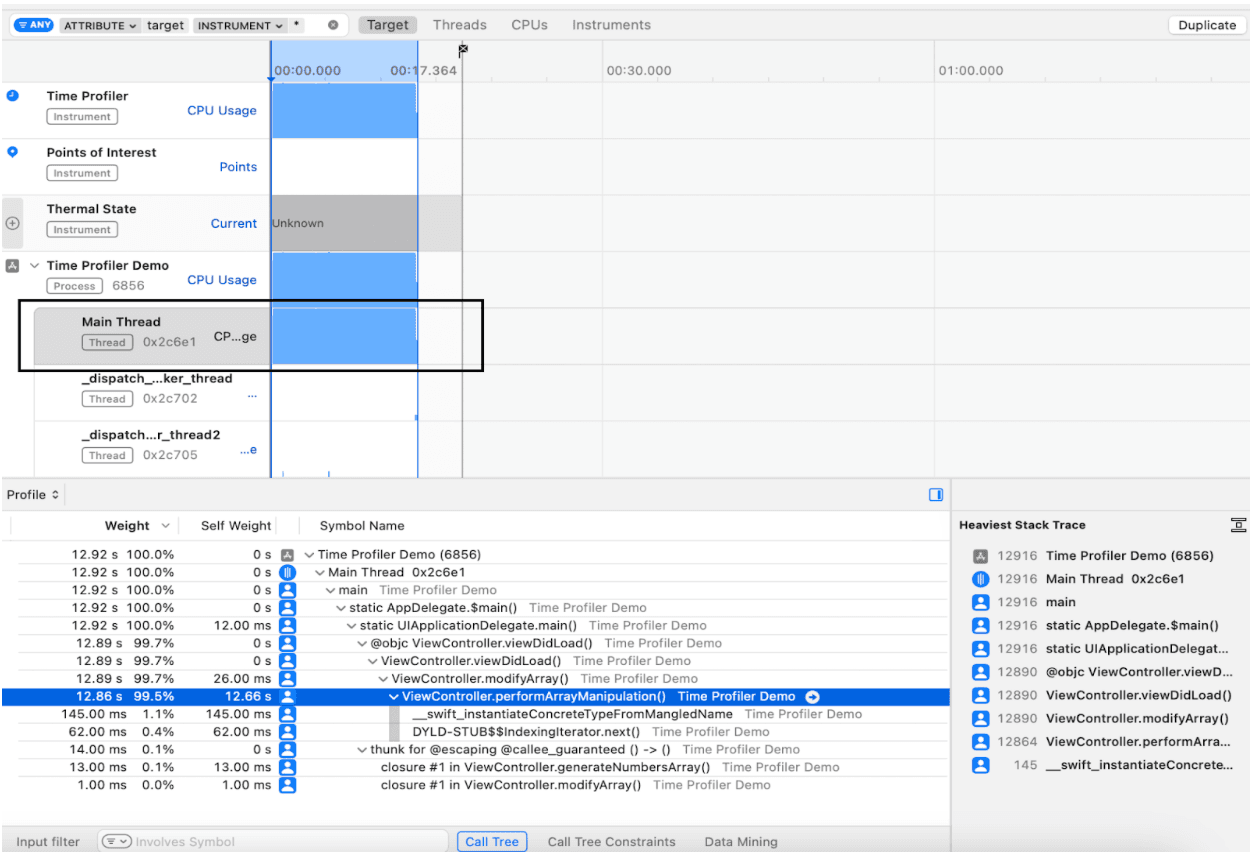
In the provided code snippet, we notice that the array manipulation is performed synchronously on the main queue, causing the UI to become unresponsive. No worries – the Time Profiler is here to the rescue!
Upon analyzing the code in the Time Profiler Instrument, it becomes evident that CPU usage is at 100% in the Main thread, causing the UI to be unresponsive. The Time Profiler further reveals that the performArrayManipulation method takes a significant 12.66 seconds on the main thread, contributing to the UI's sluggishness.
To boost app performance, let's optimize the performArrayManipulation method by performing the array manipulation asynchronously using a global async queue. By doing this, we delegate the time-consuming task to a background queue, freeing up the main thread for UI updates.
func modifyArray() {
    // Perform array manipulation asynchronously using global    async:
    DispatchQueue.global().async {
        let modifiedNumbers = self.performArrayManipulation()
        DispatchQueue.main.async {
            self.modifiedArrayTextView.text = modifiedNumbers.description
        }
    }
}

func performArrayManipulation() -> [Int] {
    // Simulate a computationally intensive task
    var sum = 0
    for _ in 1...100000000 {
        sum += 1
    }

    let modifiedNumbers = numbers.filter { $0 % 2 != 0 }
    return modifiedNumbers
}
The result of this optimization is evident in the timeline of the Time Profiler Instrument. Now, the CPU usage is 100% for a background thread instead of the main thread, ensuring that the array manipulation happens asynchronously and the UI remains responsive.
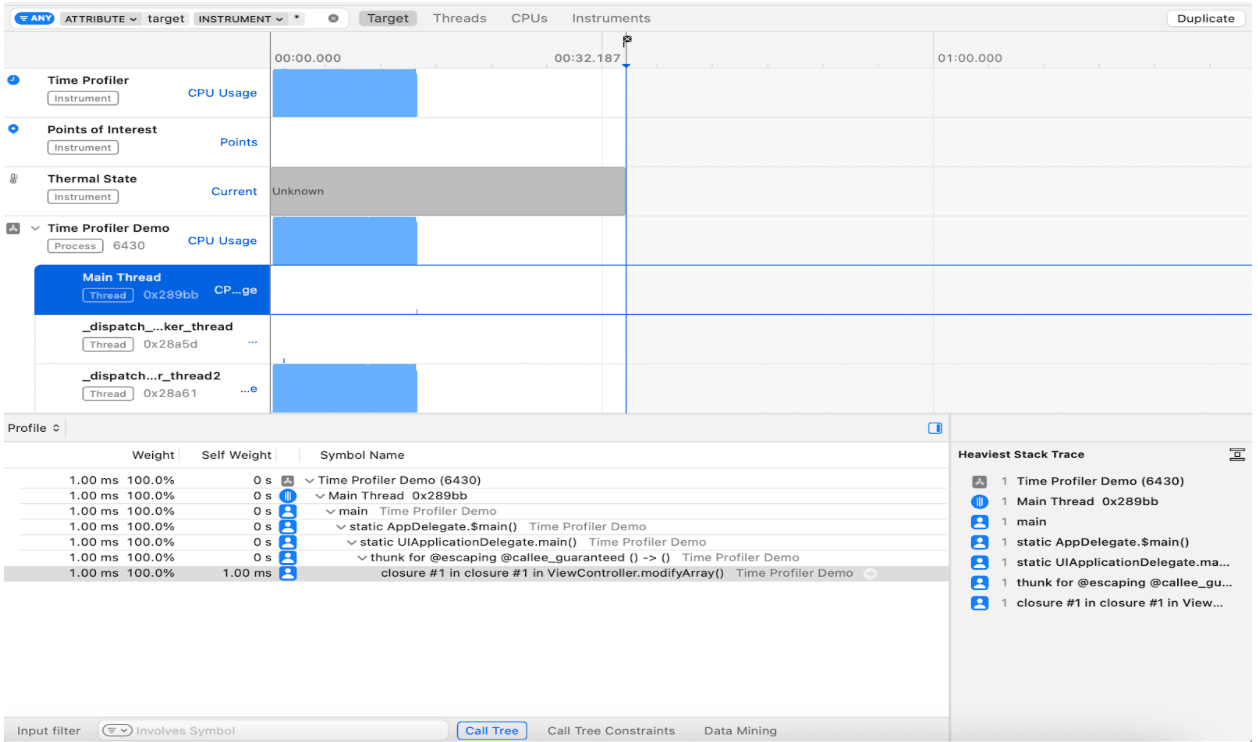
By utilizing the Time Profiler Instrument to identify performance bottlenecks and optimizing the array manipulation to be asynchronous, we successfully mitigate UI unresponsiveness and improve overall app performance.
Allocations Instrument - let’s save memory
Monitoring Memory Allocations and Deallocations
We all know how crucial memory management is in app development. With the Allocations Instrument by our side, we can monitor memory allocations and deallocations, ensuring that our apps use memory efficiently and stay clear of memory leaks. After all, excessive memory usage can lead to performance issues and even potential crashes – definitely something we want to avoid!
Benefits of Using the Allocations Instrument
The Allocations Instrument provides valuable insights into an app's memory usage, allowing developers to:
- Track memory allocations and deallocations in real-time.
- Identify memory leaks, which occur when objects are no longer in use but still occupy memory.
- Optimize memory usage and minimize the app's memory footprint.
Analyzing Allocations Instrument Data
The Allocations Instrument offers various views and features to analyze memory-related data. You can explore the call tree, which shows memory usage by function or method, and drill down into specific objects to examine their memory footprint. Additionally, you can filter allocations by category, size, or lifespan, helping you identify memory-intensive areas of your code.
Code Example Showcasing Allocations Instrument Capabilities
Alright, time to put the Allocations Instrument to work! We've got a code snippet that creates new instances of table view cells every time a cell is needed. This approach can lead to excessive memory usage and performance issues, especially when dealing with a large number of cells.
func tableView(_ tableView: UITableView, cellForRowAt indexPath: IndexPath) -> UITableViewCell {
    let cell = CustomCell(style: .default, reuseIdentifier: "Cell")
    let person = people[indexPath.row]
    cell.nameLabel.text = person.name // Set the name label
    cell.ageLabel.text = "Age: \(person.age)" // Set the age label
    return cell
}
Using the Allocations Instrument, let's analyze the problematic code to identify potential memory growth.As we scroll the table view, we might notice the Live Bytes value in the instrument keep increasing – a clear sign of memory being allocated but not properly deallocated.
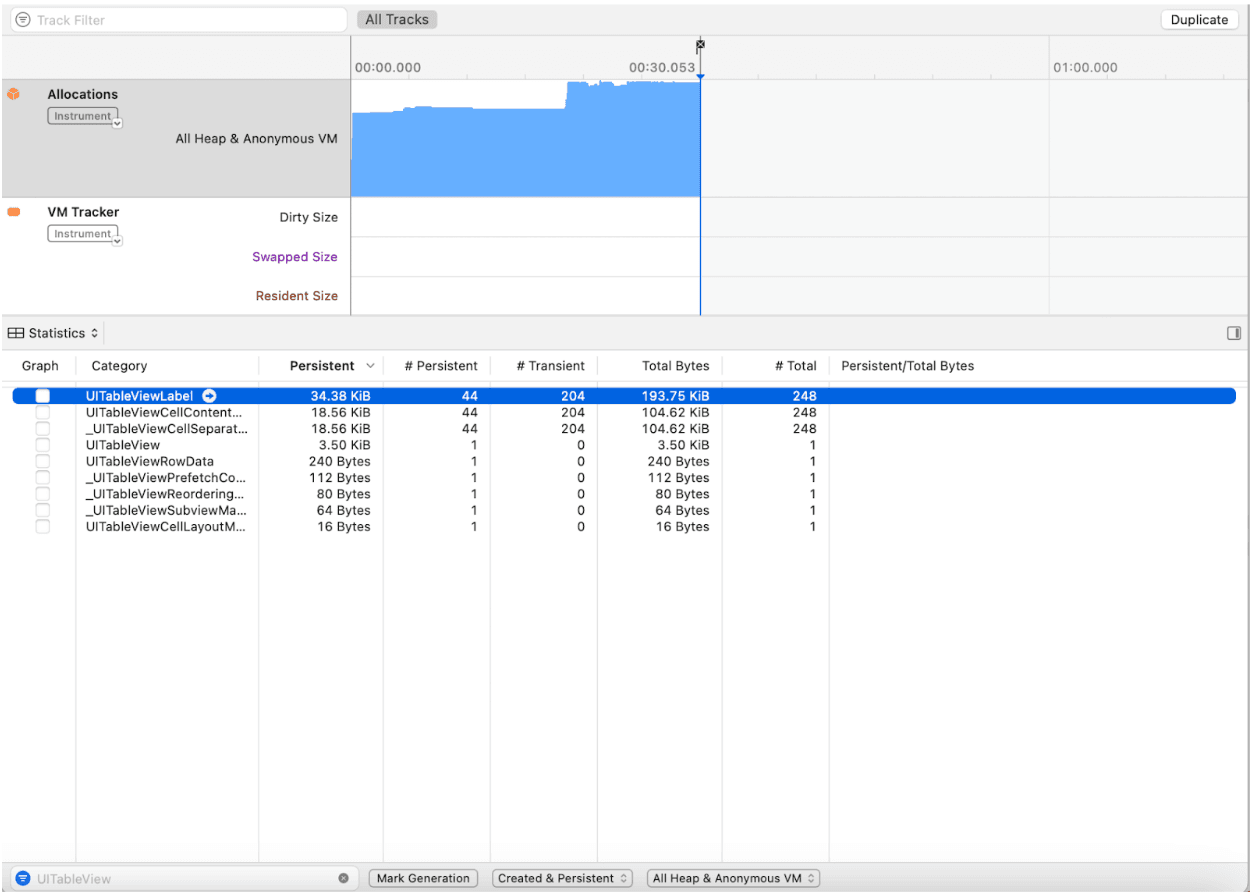
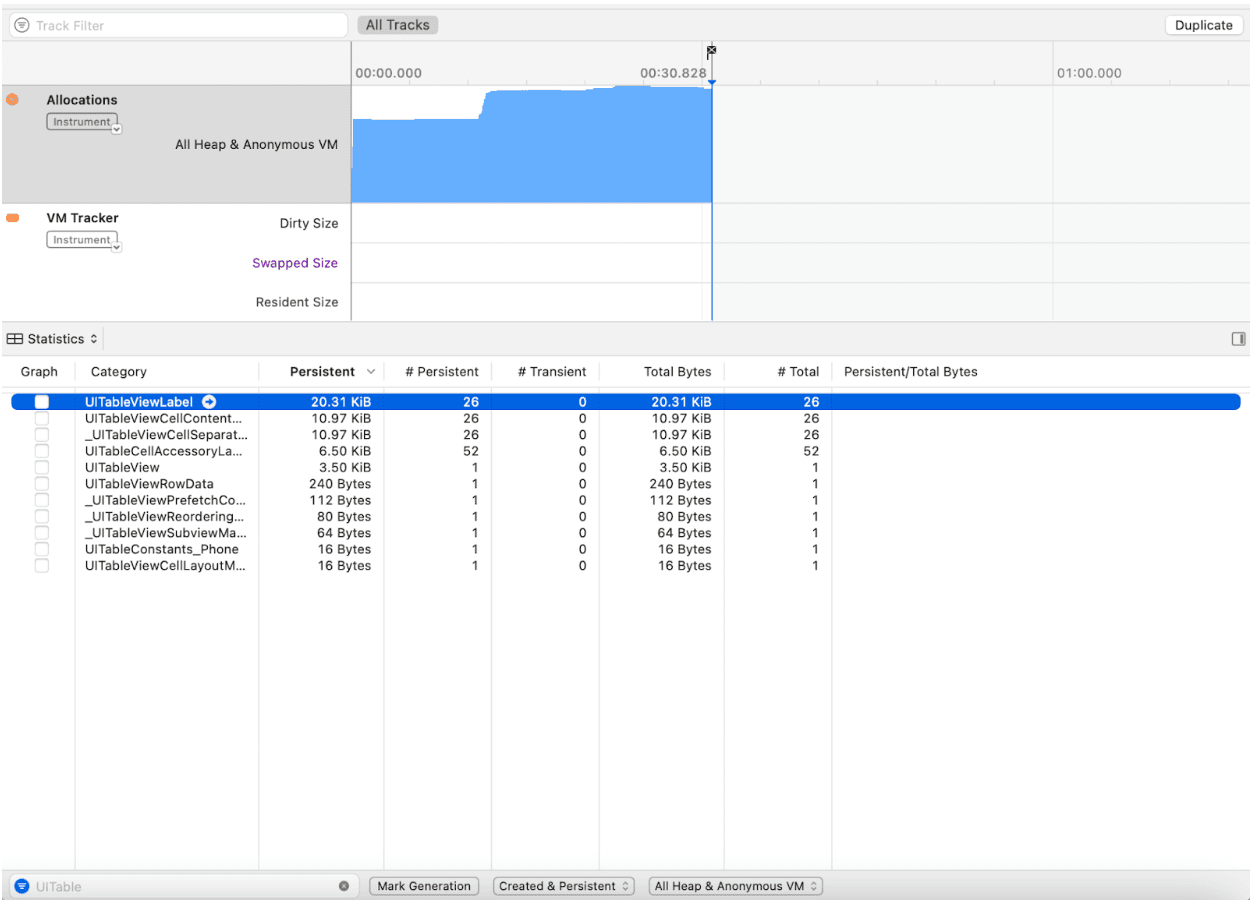
The Allocations Instrument provides insights into the number of persistent, transient, and total objects in memory:
- Persistent Objects: These objects persist throughout the lifetime of the application or a particular context, typically holding essential data or state.
- Transient Objects: These are short-lived objects that are created and destroyed frequently based on specific needs or events.
- Total Objects: This represents the overall count of objects currently in memory, including both persistent and transient objects.
In the problematic code, the transient objects count will be high and continue to increase as you scroll since new instances of CustomCell are created for each row. This results in a large number of transient objects being created and destroyed rapidly, leading to excessive memory usage.
To address the memory issues, we can reuse table view cells using the dequeueReusableCell(withIdentifier:) method. By reusing cells, we reduce the number of transient objects (cell instances) created and discarded as we scroll through the table view. This approach significantly improves memory efficiency by recycling existing instances rather than constantly allocating and deallocating new instances.
func tableView(_ tableView: UITableView, cellForRowAt indexPath: IndexPath) -> UITableViewCell {
    let cell = tableView.dequeueReusableCell(withIdentifier: "Cell", for: indexPath) as! CustomCell

    let person = people[indexPath.row]

    cell.nameLabel.text = person.name // Set the name label
    cell.ageLabel.text = "Age: \(person.age)" // Set the age label

    return cell
}
Let's put our optimization to the test by analyzing the fixed code using the Allocations Instrument again. We should observe a:
- Stable count of persistent objects as we scroll.
- Significantly reduced count of transient objects compared to the problematic code.
- Lower total number of objects in memory, as cell reuse decreases the overall memory footprint.
By using the Allocations Instrument and implementing cell reuse, we can effectively manage memory usage in our table view and prevent excessive memory growth. Reusing cells not only improves memory efficiency but also enhances the performance of our app, providing a smoother user experience.
Next stop on our Xcode Instruments tour is the Zombies Instrument. Let's equip ourselves to detect and eliminate memory zombies, keeping our app memory-efficient.
Zombies Instrument - let’s kill zombie objects
Introduction to Zombies Instrument
The Zombies Instrument is a remarkable tool for developers to detect and debug memory-related issues, especially the misuse of zombie objects. Zombie objects are objects that have been deallocated but are still accessed, leading to crashes and unpredictable behavior in the app.
How it works internally
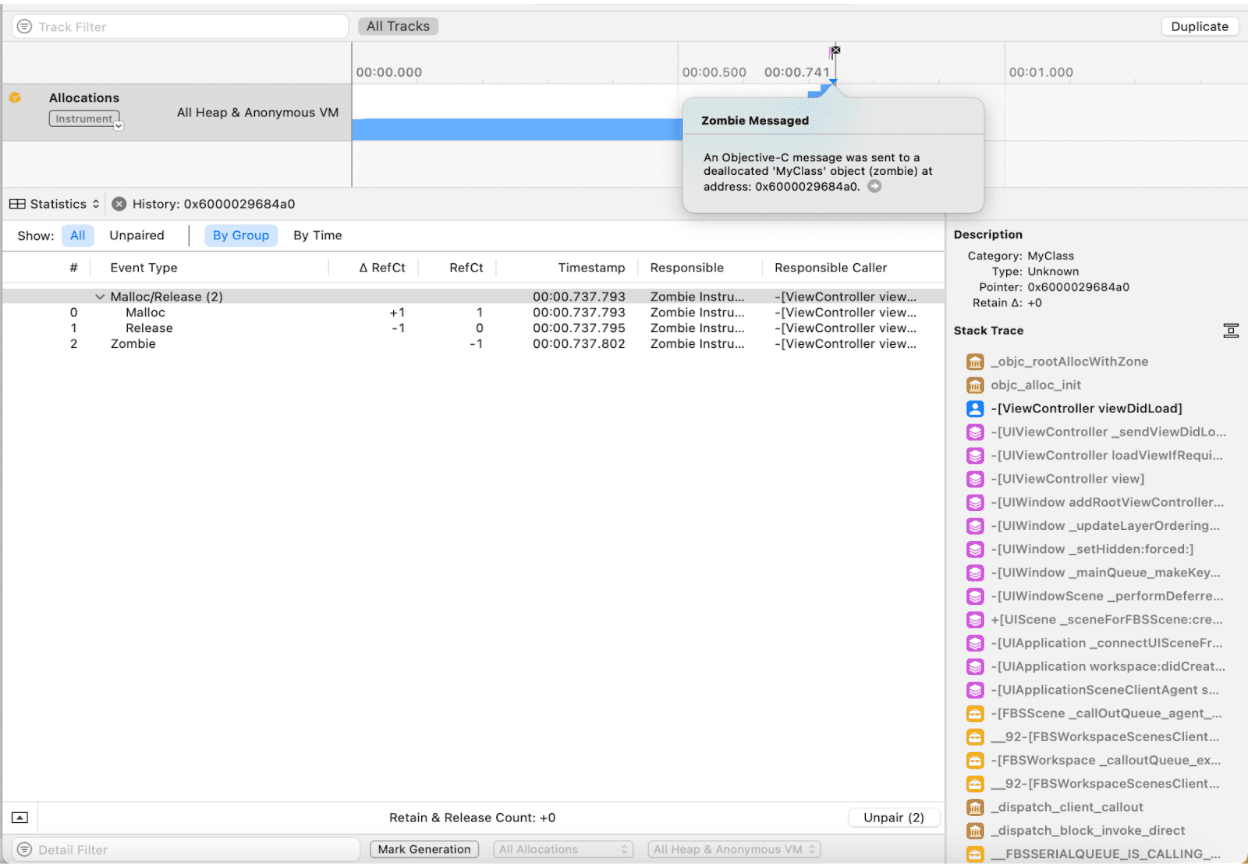
The Zombies Instrument operates by transforming deallocated objects into “zombie objects”. Instead of deallocating them immediately, it keeps them around as “zombies” with a reference count of one. If the app attempts to access a zombie object, the Zombies Instrument raises an exception, giving us a chance to catch the issue and debug it before it leads to a crash.
Detecting and Debugging Memory-Related Issues
So, how can we put the Zombies Instrument to good use? Well, we can use it to identify which objects have turned into zombies and follow the trail of events that led to their deallocation. The instrument displays a history of retain and release events, allowing you to see when the object was created, retained, released, and deallocated.
Code Example Illustrating Zombies Instrument Functionality
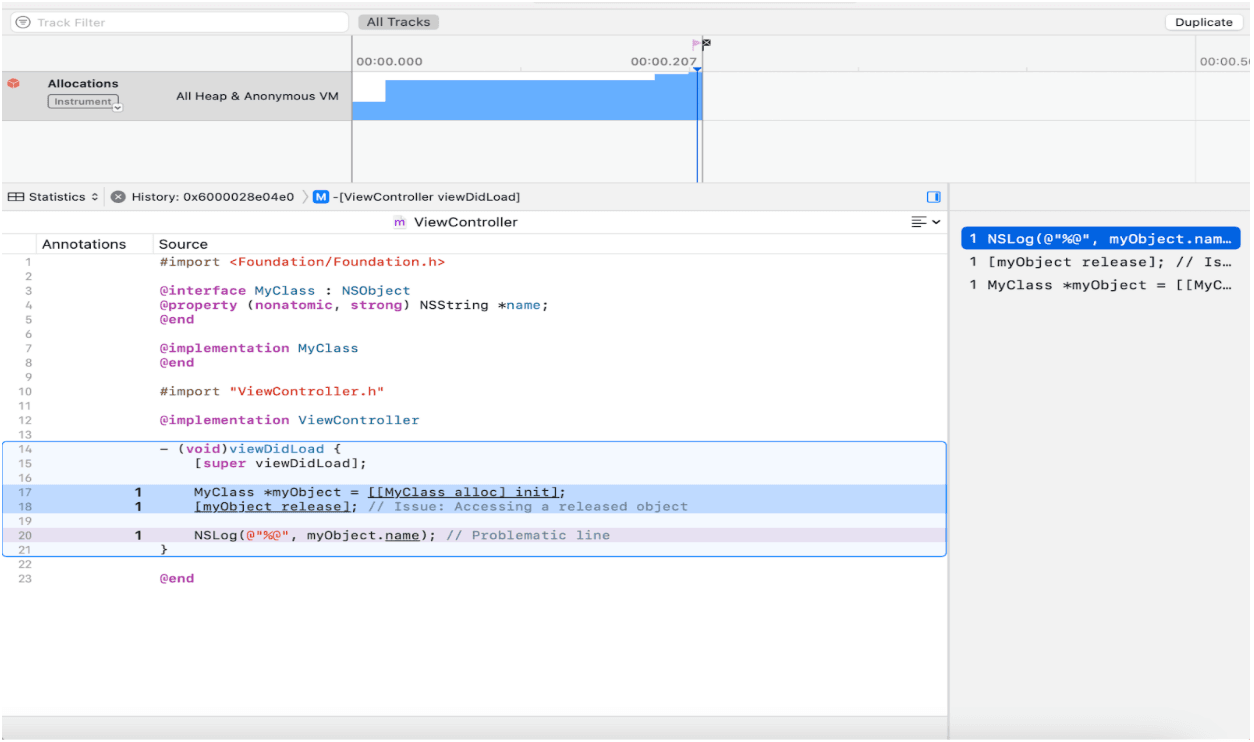
Okay, let's dive into some code trouble! In the provided code, there's a critical issue – it attempts to access a released object (myObject) after it has already been deallocated. This can lead to a potential crash or unexpected behavior in the app.
#import <Foundation/Foundation.h>

@interface MyClass : NSObject
@property (nonatomic, strong) NSString *name;
@end

@implementation MyClass
@end

#import "ViewController.h"

@implementation ViewController
- (void)viewDidLoad {
    [super viewDidLoad];

    MyClass *myObject = [[MyClass alloc] init];
    [myObject release]; // Issue: Accessing a released object

    NSLog(@"%@", myObject.name); // Problematic line
}

@end
Upon analyzing the timeline in the Zombies Instrument, a message appears precisely when the Zombie object was accessed. Clicking on the arrow button in this message displays when the object was allocated and subsequently deallocated in the call tree hierarchy.
By clicking on the code in the Stack trace, we gain access to the exact segments of code where the object was allocated, deallocated, and accessed after its deallocation. This information provides a comprehensive understanding of the object's lifecycle and allows us to identify the point where the unexpected access occurs.
With this detailed information from the Zombies Instrument, we can take corrective action to address the memory-related issue. By refining memory management practices and ensuring that released objects are not accessed, potential crashes and unexpected behavior in the app can be prevented.
Wrapping Up
With the Time Profiler Instrument, we identified performance issues, the Allocations instrument enabled us to detect memory issues, and the Zombies instrument helped us to track down and resolve memory-related crashes. There are other instruments as well for you to explore such as Leaks and Network instrument which helps in detecting memory leaks and analyze network activity and performance respectively.
In the pursuit of excellence, there's always more to explore and learn. The journey of app performance optimization continues with more tools and techniques to enhance development workflows and delight users. As we continue to delve into the depths of iOS app development, we eagerly anticipate sharing more exciting insights and tips with you. Happy coding!