
Introduction
Imagine you’ve just installed a new Android app that you’re dying to try out. But instead of launching, the app just sits there on the initial screen. You wait for a few more seconds but still nothing happens. Finally after what feels like an eternity, the app launches, but it’s far from the seamless experience you hoped for. The lagging performance only adds to your frustration, leaving you questioning whether the app is worth your time.
In today's mobile-driven era, time is of the essence. When users install a new app, they expect it to launch swiftly and smoothly, without any frustrating delays. In this blog, we'll explore the critical importance of app launch time and also check some effective strategies to optimize it. Let's dive right in!
Understanding app launch time and unraveling startup states
Startup time, also known as app launch time, refers to the duration it takes for the application to start up and become ready to use once a user initiates the launch. It is a critical metric for measuring the performance of an application, as a slow startup time can be a major turn-off for users.
App startup states represent different phases an app goes through from launch to becoming fully usable. There are three states - cold, warm and hot.
Cold start
- This refers to the app starting from scratch, either on first launch or after being terminated from memory.
- Clearing the app from recents causes it’s process to terminate and recreation of the same ends up taking some CPU cycles.
- It takes the longest time as it involves initializing the app’s components and resources entirely.
Warm start
- This occurs when the app process is not terminated and runs in the background. The app must recreate the activity by calling onCreate().
- This can happen when you close your app using the back button and then open it again from the launcher or recents.
- In this case, the app’s activity is destroyed but the process is not killed by the system.
- It is quicker as some components and resources are already initialized.
Hot start
- This is the fastest because all the system does is bring the activity to foreground, providing a near-instantaneous experience by resuming from where the user left off.
- It is when you move an app to the background and then open it from the launcher or recents, provided that the app process is not terminated by the system.
- Unlike cold start or warm start, nothing needs to be recreated.
Let’s take a look at an example for better understanding:
- You freshly click on an app launcher after clearing the minimized apps. This will bring your app to the foreground and is an example of Cold start.
- Now, you click on the home button to minimize your app (it will go in paused/stop state) and leave/forget that app. There will be two scenarios when you switch back to your app. If it starts from exactly where you left without reinitializing anything, that is a Hot start.
- But, if your activity is recreated or re-initialized, it refers to a Warm start. This might happen because your activity, when paused, got killed by the OS as it was short on memory or for any other reason.
Understanding app states is crucial as a developer, because it will help you know what optimizations will lead to better experience under which scenario.
What are different app startup metrics?
In this section, we'll explore the critical metrics that shed light on your app's startup performance.
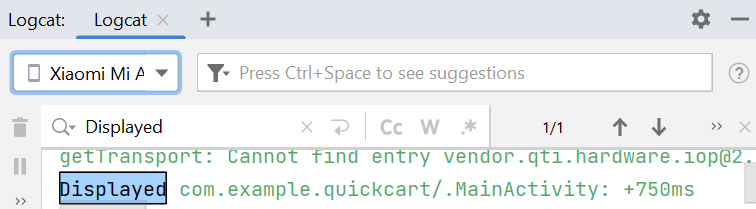
TTID (Time to initial display) is basically the time it takes for an application to produce its first frame. It can be checked in Android 4.4 (API level 19) and higher. To check TTID:
- Connect your device/emulator with Android Studio.
- Launch the app and observe Logcat should include an output line containing a value called "Displayed".
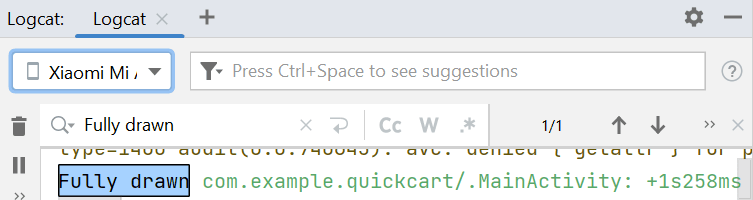
TTFD (Time to full display) is the time taken for an application to be rendered completely and be ready for user interaction. To check TTFD:
- Connect your device/emulator with Android Studio.
- Add a callback for the reportFullyDrawn() method in your home screen activity after all the content is visible on the screen.
- Launch the app and observe Logcat should include an output line containing a value called "Fully Drawn".
The startup time is considered as excessive when:
- Cold startup takes 5 seconds or longer.
- Warm startup takes 2 seconds or longer.
- Hot startup takes 1.5 seconds or longer.
How to check the app startup time?
In this section, we will look at some tools and ways to measure app startup time for different states.
1. Android debug bridge (adb)
- You can use the following adb command to display the time application took for Cold, Warm or Hot start:
adb shell am start-activity -W -n <PACKAGE_NAME>/.<ACTIVITY_NAME> - The below snippet shows the cold start time of an app. To check this, clear the application from recent apps list and then execute the command.
PS C:\Users\Team-RSL\AppData\Local\Android\Sdk\platform-tools> ./adb shell am start-activity -W -n com.example.quickcart/.MainActivity Starting: Intent { cmp=com.example.quickcart/.MainActivity } Status: ok LaunchState: COLD Activity: com.example.quickcart/.MainActivity TotalTime: 732 WaitTime: 735 Complete - For warm start, perform hardware back press on MainActivity to ensure that activity is destroyed. Then run the command to get Warm start time.
PS C:\Users\Team-RSL\AppData\Local\Android\Sdk\platform-tools> ./adb shell am start-activity -W -n com.example.quickcart/.MainActivity Starting: Intent { cmp=com.example.quickcart/.MainActivity } Status: ok LaunchState: WARM Activity: com.example.quickcart/.MainActivity TotalTime: 108 WaitTime: 110 Complete - Similarly for Hot start, run the command after you click on the home button to minimize the app.
PS C:\Users\Team-RSL\AppData\Local\Android\Sdk\platform-tools> ./adb shell am start-activity -W -n com.example.quickcart/.MainActivity
Starting: Intent { cmp=com.example.quickcart/.MainActivity }
Warning: Activity not started, its current task has been brought to the front
Status: ok
LaunchState: HOT
Activity: com.example.quickcart/.MainActivity
TotalTime: 71
WaitTime: 84
Complete
2. Logcat
- As we discussed in the metrics part above, the TTID is displayed in logcat and TTFD can be displayed by explicitly calling reportFullyDrawn() in your code.
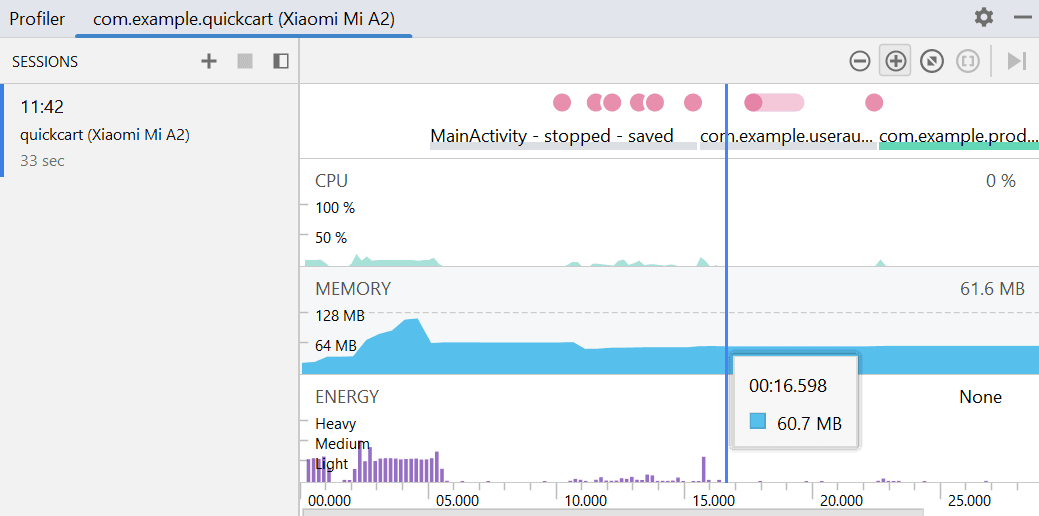
3. Android Profiler
- This tool does not directly give you the TTID or TTFD, instead you have to analyze the displayed CPU and memory usage data to check startup performance.
- In the CPU view of the profiler, you have to check for prolonged spikes of CPU usage at app startup and then analyze the code to find its cause.
- Similarly, for memory usage you have to look for significant memory allocation or memory leaks which can hamper startup time.
- This tool provides you insights on how your app utilizes resources on startup.
4. Systrace
- System tracing simply refers to capturing device activity over a short period of time.
- Systrace is a tool for system tracing which provides detailed information about CPU usage and threads. It works on API level 18 (Android 4.3) or higher.
- You can also record system trace from your Android device through developer options.
- If the device is running Android 10 or later, the file is saved with ‘.perfetto-trace’ extension and can be opened with Perfetto UI (Perfetto is simply an advanced alternative for systrace). Earlier Android versions create the file with ‘.ctrace’ extension, denoting the Systrace format.
- You can then go and analyze the code involved during app start up and fix the issues causing heavy CPU usages.
- Refer this for more information about system tracing.
5. Android Vitals
- If your app is published on Google Play Store, Android Vitals can be utilized to determine App startup time.
- It is a part of Google Play console and provides us data like app startup time, number of ANRs, number of crashes, etc, which can be used to measure app quality.
- It uses the TTID metric to render your app startup time, and is displayed in your Play console.
- Refer this for more details on Android Vitals.
5 reasons your app startup may be slow
Now let’s look at some factors which affect app startup performance.
1. Heavy app and activity initialization
- To gain a deeper understanding, let us first look into what exactly happens during the cold start process.
- Cold start involves a lot of tasks, but below is the high level flow of the process:
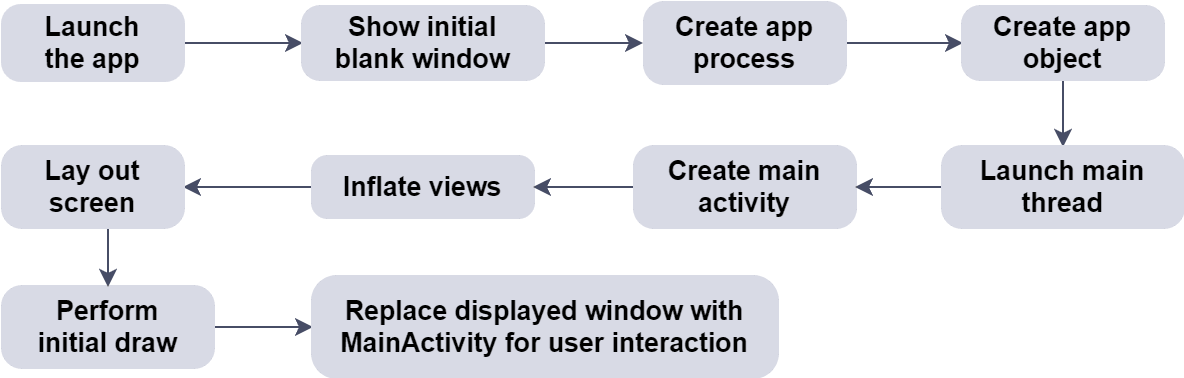
Figure 4: High level app cold start process - Basically first the Android’s Application object is created and then the main activity. The app launch performance will suffer if your code overrides Application’s onCreate() and executes heavy work in it.
- Activity creation, even if relatively quicker, involves high-overhead work which once optimized can lead to performance improvements. Some common issues include:
- Inflating large or complex layouts.
- Blocking screen drawing due to cache or network I/O.
- Loading and decoding bitmaps.
- Rasterizing VectorDrawable objects.
- Initialization of other activity subsystems.
- If you get spikes for Memory usage in Profiler while your application is launched it could be an indication of heavy activity initialization.
2. Excessive initialization
- This refers to a situation where an app performs initializations unnecessary for startup.
- It could be loading multiple libraries, fetching data which doesn't need to be displayed initially, etc.
- Take, for instance, an application which uses an image processing library for a specific feature that isn't used during the app's initial launch. Loading this can be deferred till the user actually has to use the feature.
- Additionally, consider a scenario where the app fetches more data than what is required for the initial screen. This can be handled through lazy loading which we will discuss later.
- If you get spikes for CPU usage in Profiler or Systrace while your application is launched it could be an indication of heavy excessive initialization.
3. Large image and media files
- The launch time takes a significant hit if there are large and inefficient media files which should be loaded at app startup.
- Consider using more efficient image formats like SVG as opposed to big PNGs. SVGs are faster due to their small size as opposed to PNGs. Although there might be instances where a complex SVG takes more time to be rendered than a PNG. Choose wisely. 🙂
4. Disk operations and network requests
- You should defer any unimportant disk access or network requests after the app is launched.
- Due to the unpredictable nature of the network, slowness and failures are to be expected. Hence, you should not depend on them for your app to start even if fetching a small amount of data.
- For example, an app might not be displaying the initial screen until the data is fetched. Instead it can show a shimmer effect where the fetched data should be displayed and let the user interact with other parts of the app.
5. Custom splash screens
- In API 30 or lower Android versions, to implement a themed launch screen, you either use the windowDisablePreview theme attribute to turn off the initial blank screen, or use a dedicated activity.
- However, from Android 12 it is necessary to use the SplashScreen API. This API offers faster startup time and also provides you the flexibility to customize (duration, animation, etc) your splash screen.
- Additionally, it also offers backward compatibility i.e. in versions Android 11 or lower, the launch screen will look the same as before but starting Android 12, it will have the new Android 12 look and feel.
- Refer this to know more about the SplashScreen API 🙂
If app start up time is slow, you
- Should analyze CPU/ Memory usage spikes during the app startup, using tools such as Profiler.
- Profiler provides real time data on which method calls were made, resource usages and activity used, helping to zero down on the issue causing piece of code.
- Proceeding with analyzing the code would then help to determine the root cause.
- It could be one or more of the above mentioned reasons.
5 techniques to reduce your app startup time
Lastly, let’s delve into ways for minimizing app startup time!
1. Move heavy operations off the main thread
- Use background threads (e.g., Executor) for operations like data loading, image processing and network requests to avoid blocking the main thread during startup.
- The main thread is responsible for handling UI updates and interactions. If the main thread is blocked, it will lead to laggy and unresponsive behavior.
- Libraries like RxJava or Kotlin Coroutines help in handling asynchronous tasks effectively. These libraries also make your code more concise, readable and easier to maintain.
// Create an executor that executes tasks in a background thread.
val backgroundExecutor = Executors.newSingleThreadScheduledExecutor().execute {
    // Your code logic goes here
}
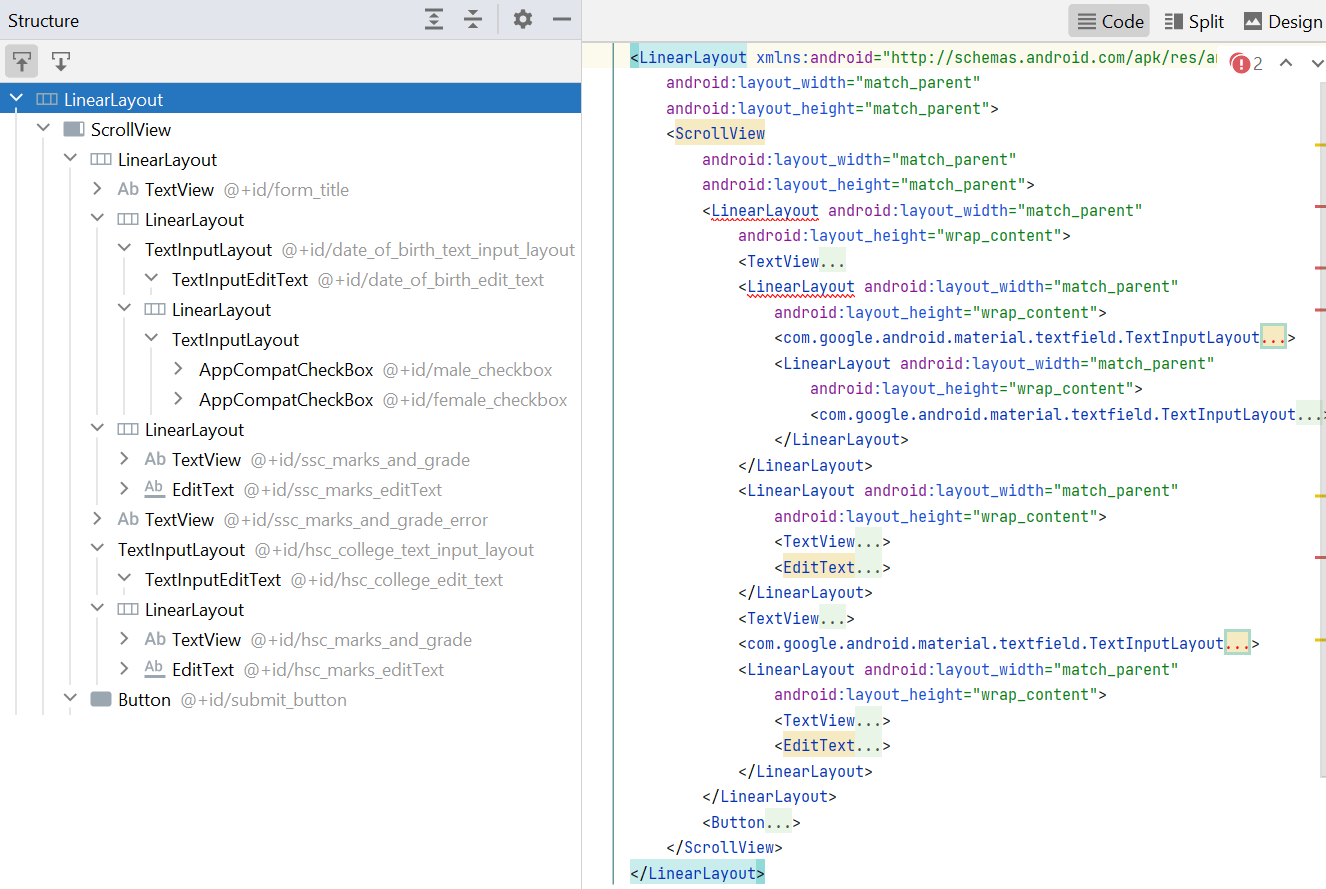
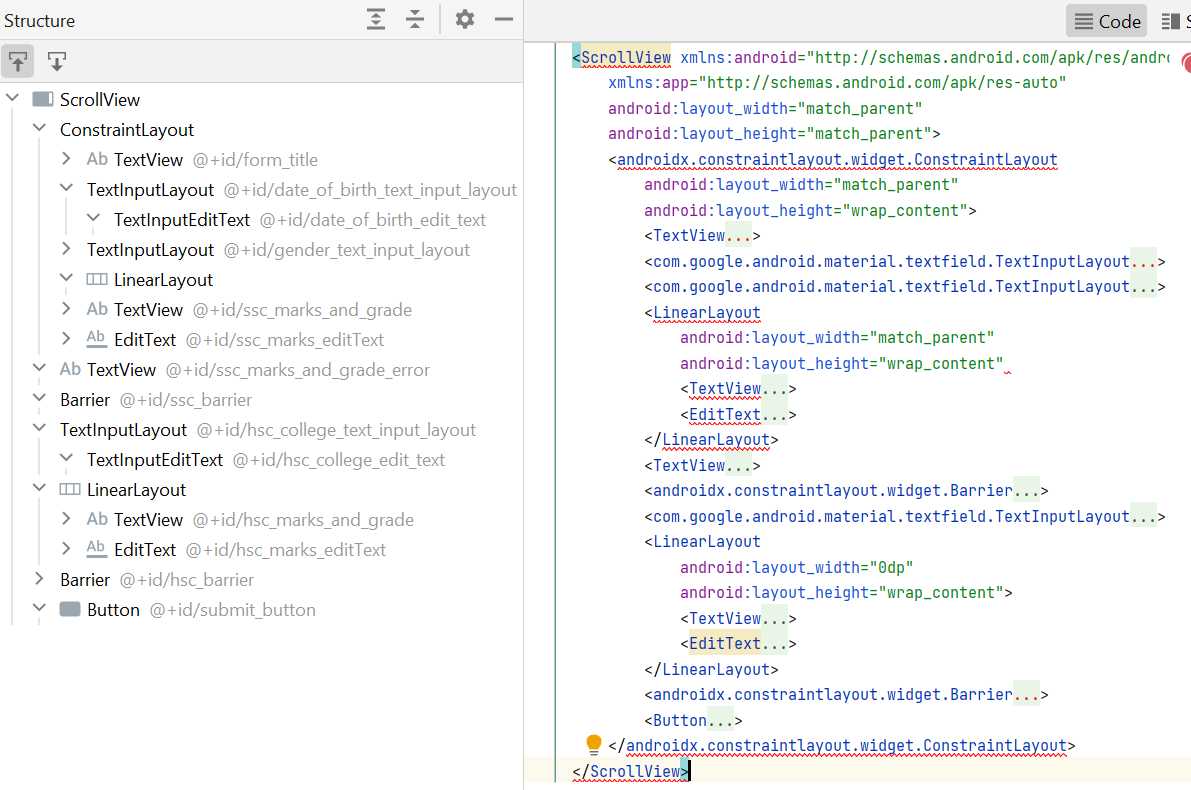
2. Optimize the view hierarchy
- Simplify and flatten the view hierarchy by removing unnecessary nested layouts. Use the efficient LinearLayout, ConstrainLayout instead of FrameLayout where possible.
- Additionally, consider replacing heavy views or layouts with lightweight alternatives to improve performance.
- I replaced nested view hierarchies with ConstraintLayout in an old project to increase the app performance.
- Below is a sample view hierarchy before and after optimization.
3. Implement lazy loading
- Instead of pre-loading everything during app startup, load resources (data, images, etc) only when they are actually needed.
- You can also try using techniques like pagination or on-demand loading to fetch data incrementally, reducing initial load time.
- For example, if you have an application which fetches data for 100 items from the server, but displays only 10 on the initial screen, you can reduce the fetch count from 100 to 20. You can fetch further data if and when the user scrolls to end.
4. Enable app level optimizations
- Optimize the app’s code and resources by enabling ProGuard or R8. This will shrink, obfuscate, and reduce the APK size, leading to improved startup time.
- I tried ProGuard in a sample app and the APK size dropped significantly, from 9.7 MB to 2.6 MB! To enable ProGuard in your app, you can simply add the following code snippet in your build.gradle file:
buildTypes {
    release {
        minifyEnabled true
        shrinkResources true
        proguardFiles getDefaultProguardFile('proguard-android-optimize.txt'), 'proguard-rules.pro'
    }
}
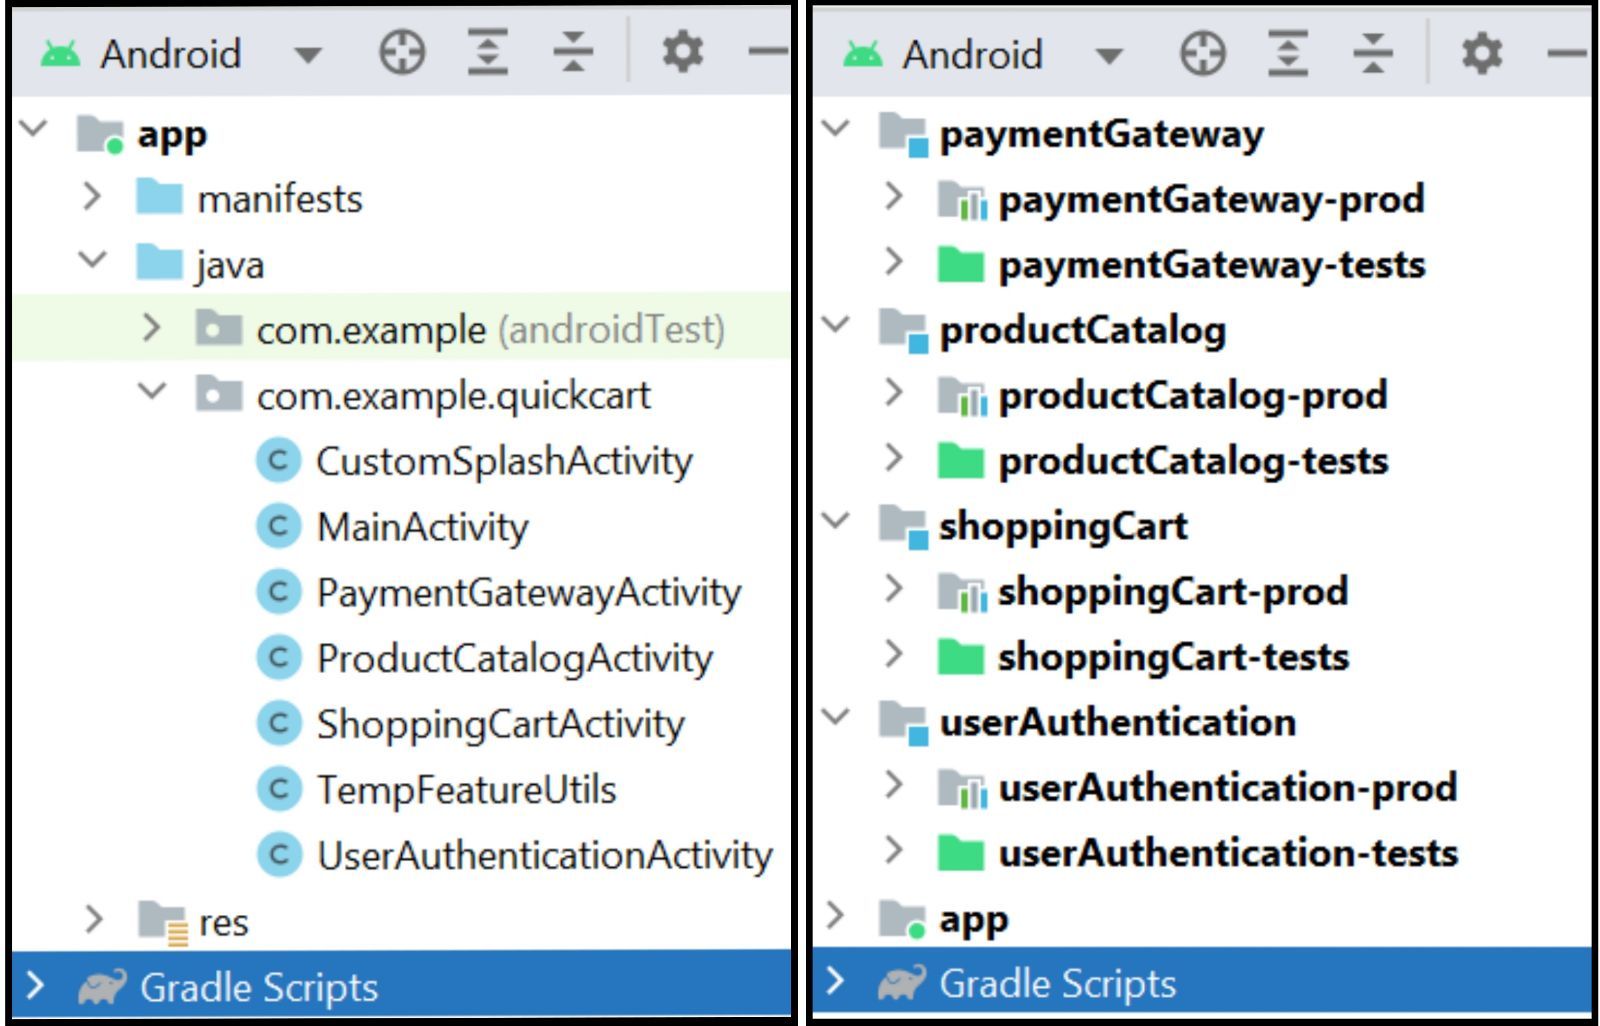
5. Modularizing the application
- Enhance initial loading time by modularizing your app into smaller, independent modules. Dynamically load only necessary modules and resources during startup for faster performance.
- For example, an e-commerce app with multiple features is tightly integrated, leading to increased cold start time. But once modularized, it will only load the modules and resources which are actually required, reducing launch time.
- The below image depicts the before (left) and after (right) structure of a modularized project.
As we near the conclusion of the blog, here’s a demo application that highlights potential causes of a sluggish app startup. Additionally, you can refer to this PR, which incorporates some of the techniques we covered to enhance app startup speed within that project.
Conclusion
I hope you enjoyed reading and found this blog informative. Let’s have a quick recap of what we learnt:
- App startup states - cold, warm and hot (slowest to fastest).
- Metrics to analyze app startup time are TTID (Time to initial display - also used in Android vitals) and TTFD (Time to full display).
- How to measure startup time? - adb command, logcat, Android profiler, Systrace and Android vitals.
- What affects app startup time? - Heavy app/activity/resources initialization, using large image/media files, unnecessary disk operations, network requests, and usage of custom splash screen.
- What can we do to reduce this time? - shift heavy operations off the main thread, optimize the view hierarchy, implement lazy loading, enable app level optimizations, and modularize the project.
Remember, every millisecond counts when it comes to user satisfaction. So let’s trim those precious seconds and leave a lasting impression on the users.
Some witty soul once said, “You never get a second chance to make a good first impression”.
Happy optimizing! 🚀