In your development journey, oftentimes you will be faced with problems where the underlying code is quite complex, the issue involves multiple threads that are timing sensitive, and you could use a little extra help from the debugging tools to help you track down the issue. Some of the challenges you may encounter involve:
- You are debugging a complex multi-threading problem and lose track of how different threads are working and the interaction between them.
- You want to analyze a particular flow of code using a debugger but the breakpoints are executed through other flows as well, causing confusion.
- You are using logs to create a story of how things are working but you do not have access to edit the library code to add any meaningful logs.
- You want to observe the exact message queued on the main thread, but the debug window does not give an easy way to view the handler object at run-time.
Well, the Android Debugger provides a lot of advanced functionality to help in such scenarios — features like customized breakpoints, switching threads, tracing, evaluating objects/variables and many more. In this blog, we are going to cover a few Debugger features which will make your life easy and save a lot of debugging time and effort.
LET’S GET STARTED
Breakpoint customizations
Generally, developers use Breakpoints heavily in various parts of the flow to understand how the code runs — by adding it at a line, method, field, or exception. This causes the breakpoint to hit every time the path is executed. But oftentimes, the intent of a developer is to have a breakpoint only in specific conditions, or for a specific purpose. That is where the customized breakpoints such as conditional, dependent, and logging breakpoints come into play.
Let's understand them one by one.
Conditional breakpoints
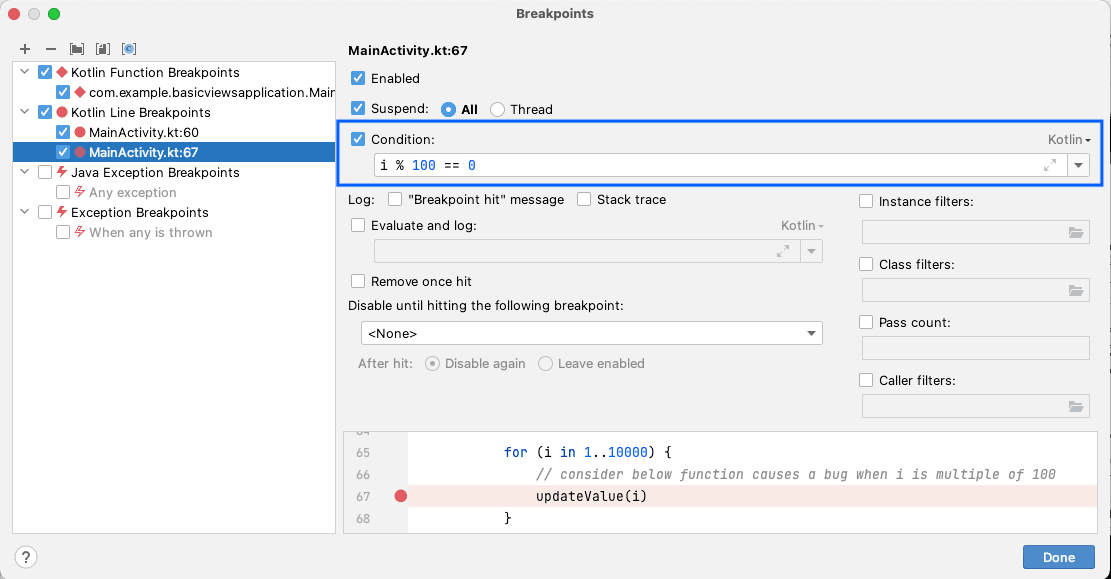
Let’s assume, you have a loop which runs through 1 to 10000 numbers, and it has a bug which is observed only when the number is multiple of 100. To debug this bug, if you add a normal breakpoint inside the loop then that breakpoint will hit 10000 times, which would be quite frustrating.
Conditional breakpoints are a form of rescue when we are only interested in the code-path in a particular scenario.
In this scenario, you could add a condition to your normal breakpoint which will ensure it hits only when the loop is iterating with a multiple of 100. Refer below screen to customize your normal breakpoint to act as a “Conditional breakpoint”.
Though Conditional breakpoint is quite useful, there is also a pitfall that you should be aware of. Even though it seems that the application does not stop at a breakpoint whose condition has not met, the debugger temporarily suspends the application while evaluating the condition. For most of the normal cases, this pause can be ignored. However, in multithreaded applications, such a pause can lead to change the order in which threads are dispatched.
Dependent breakpoints
We usually have functionalities / screens in our app that can get triggered from different code paths. Oftentimes we only want to debug a particular code-path — and not get the breakpoints to hit for other code paths.
For instance, let’s say your app has refresh screen functionality which fetches the latest data after every 2 mins. This refresh screen functionality can also get invoked manually by using a “Refresh” button click.
In such a case, let's consider your app has a bug which is only observed when you refresh the screen on button click. While debugging this issue, it could happen that the refresh screen function gets executed multiple times after each 2 mins and that would disturb your debugging session.
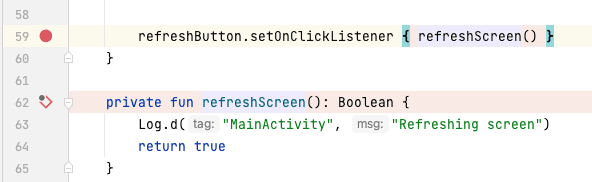
To avoid the unnecessary pauses due to automatic invocation of refresh screen functionality, you can add two breakpoints:
- First, at “Refresh” button’s click listener.
- Second, in the “refreshScreen()” method.
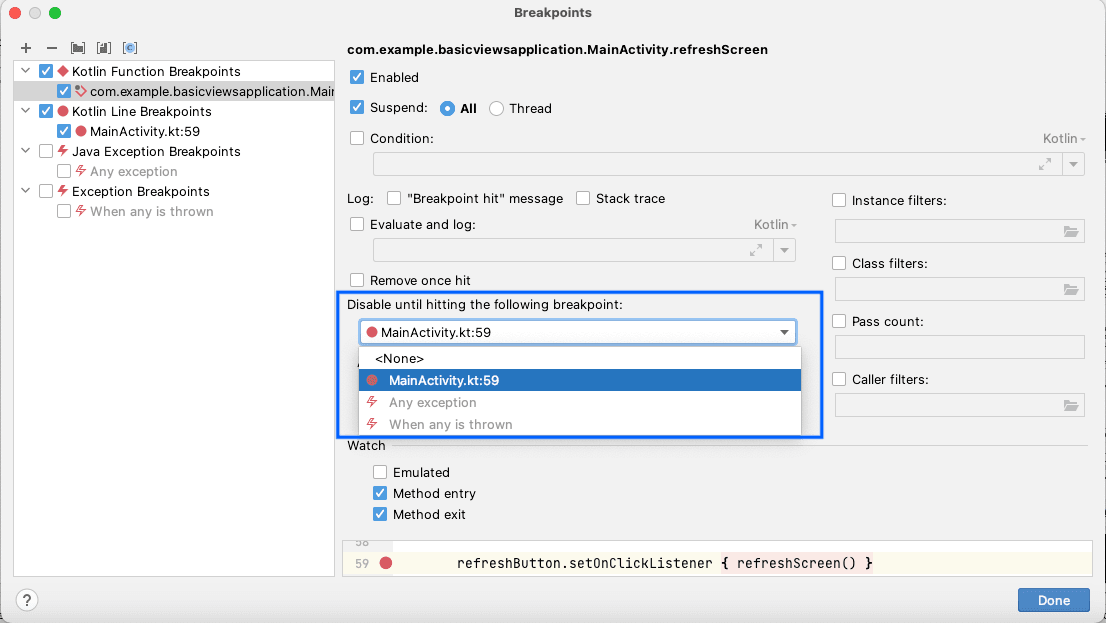
Then, you can customize the second breakpoint to be “dependent” on the first breakpoint.
You can refer below screens to understand how to add a “Dependent breakpoint”.
Logging breakpoints
While debugging the code, you might have faced a situation where you wish you could have a log that would help you to debug the suspected code block better. This might happen very often, which would waste your lot of time in just adding the logs, rebuilding the app and debugging it again.
We understand how painful and frustrating it is to rebuild an app multiple times while debugging a single bug. No more worries — Logging breakpoint is here to rescue!
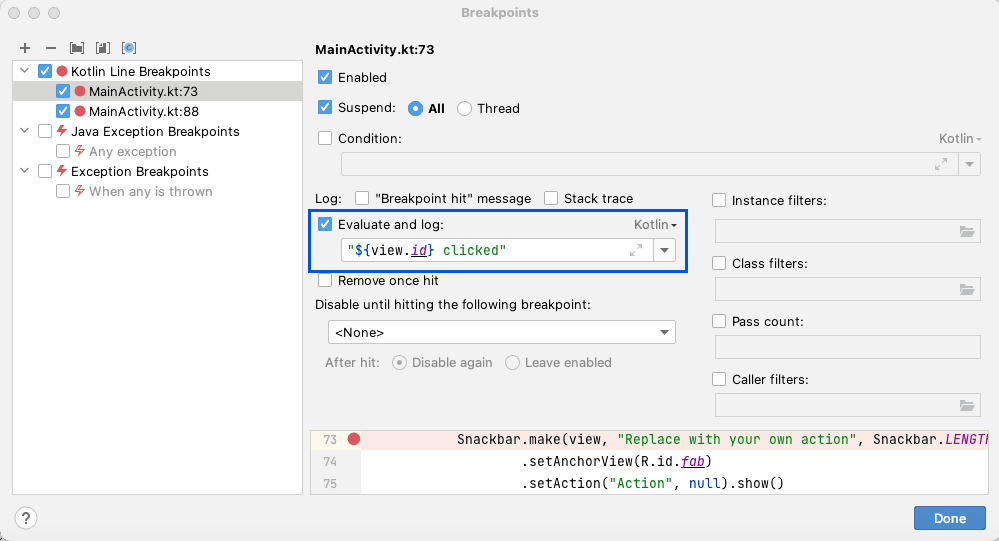
We can customize the normal breakpoint and add a log which will then act as a “Logging breakpoint” and log the message when the breakpoint is hit.
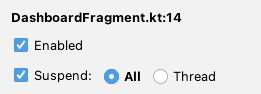
To customize a breakpoint, right click on it and in the customize window add the log that you wanted to print under the “Evaluate and Log” option. You can also choose to show the “breakpoint hit” message and stack trace in the log.
You can see the logs output in the “Console” of the debug window.
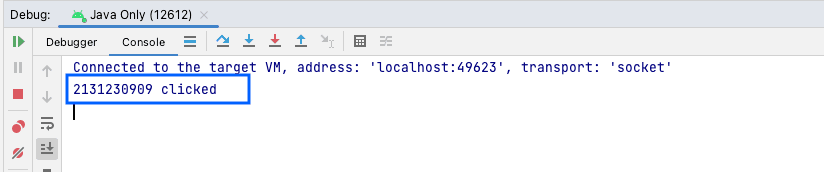
You can also use this in the library (where you cannot edit code) and log the details that you need, which we feel is quite awesome.
Note: All this logging can be done without suspending the application at the breakpoint. To do so, uncheck the “Suspend” option from the above customization window.

Suspending single thread vs all thread
By default, all threads are suspended when breakpoint is hit but suspending a single thread is quite useful while debugging threading issues such as race conditions. You can check out this good example of pausing the single thread to debug the race condition.
Debug Window features
We often see developers not using the full feature sets of the Debug window provided by the debugging tool. Debug window gives many easy ways to analyze and customize the data you are working with. Let us explore some of them. If you are new to debugging do check out debug window documentation.
Update variable value
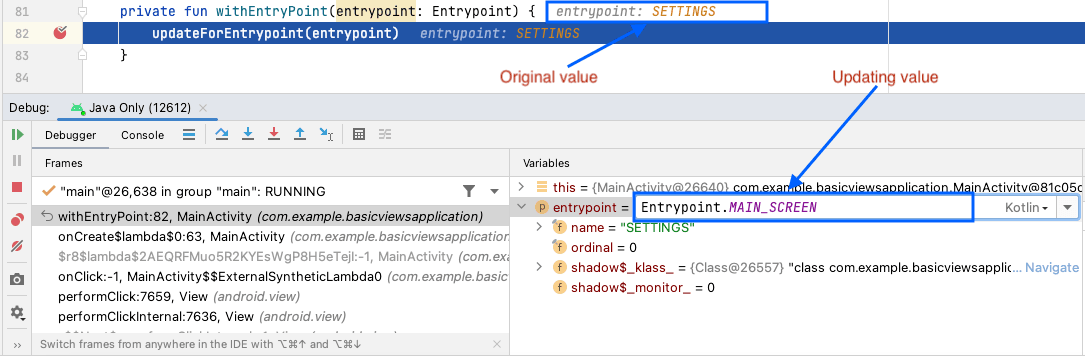
Let's say you have an enum value that controls your screen, and you are facing a bug which is observed only for one of those enum inputs — you need to figure out which one. In this case, manually debugging all the enum-values by going through different code paths is quite time consuming. Here what developers might do is to force the value by mocking it and iterating (involves code changes). But a rather smarter way is to update the variable in the debug window and execute the code.
To update the value, right click on the variable and select the “Set value” option and you can easily go through the different enum inputs now.
Pinning the Important object properties
Debug window shows objects with all its fields — a lot of them are not useful for debugging. In such a case, if you want to focus on any particular field of the object, you can use the “pin to top” feature which will help you to show the field at the top of the fields list.
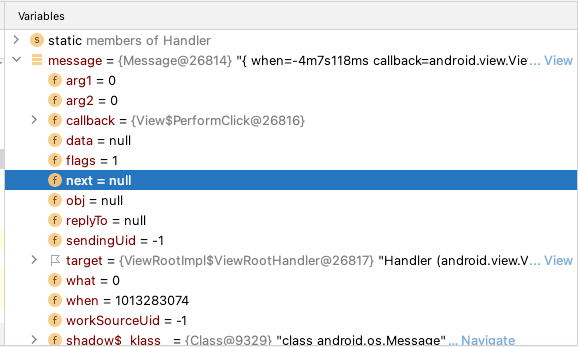
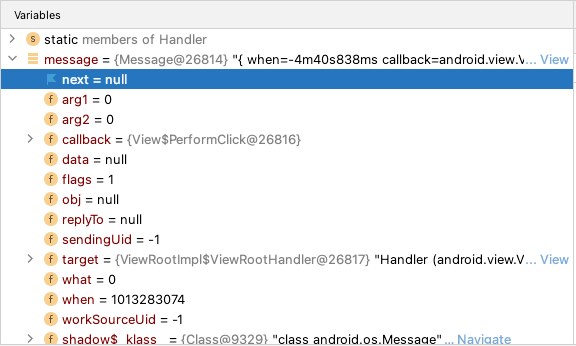
One of the best use cases, in our experience, of pinning properties is to pin the "next" property on Handler messages to know when your message is being queued.
To pin the property, right click on the property and select the “Pin to top” option. Now, observe that it will be shown at the start of the object.
Watches
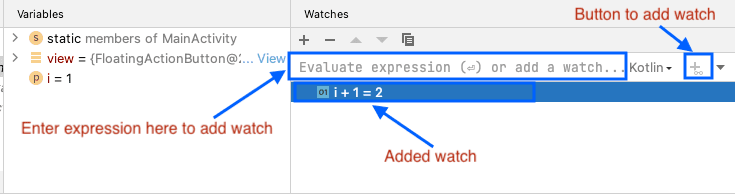
All the variables and objects in the current context are already shown in the variables tab, but what if you want to keep track of an expression value? For instance, in the sorting function, how do you analyze the value of the “i + 1” expression in an ongoing loop? To analyze and keep track of such and many more complex expressions you can add your own watch — which will then be shown in the debug window along with other variables / objects it already shows.
Track Objects throughout the Debugger session
The debug window only shows the variables / objects that are present in the current debugging context. For instance, when you switch screens in your application, the variables from the previous module are not shown in the debug window (even if they are in memory).
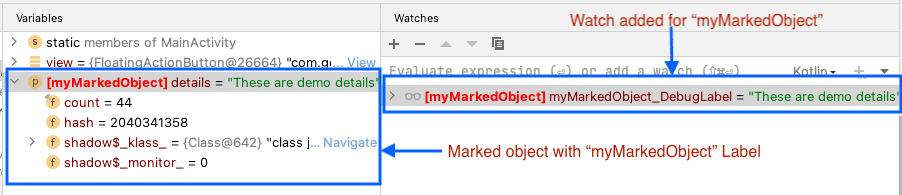
There can be scenarios where you would be interested to track the value of that object for your bug use-case / conditional breakpoint / watcher. You can achieve that by marking your object and it will get highlighted in any part of the debug window.
To Mark an object, right click on the object shown in the variables window and select the “Mark object” option. It will then ask you a label to show for this object and you can add any label of your choice. Label is just to quickly identify the object — it's optional.
Switch between threads and get thread dump
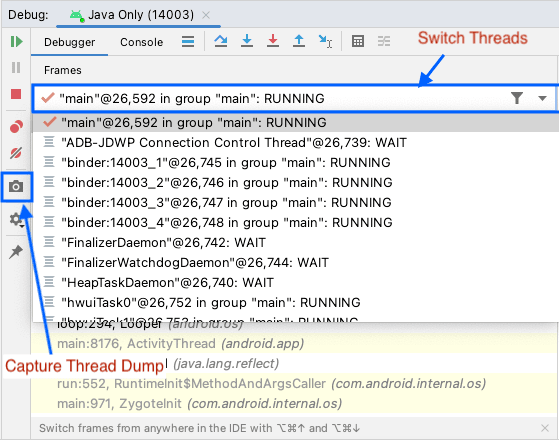
In a multithreaded environment, it becomes quite important to analyze different threads at same time. It is often important to analyze the call stack of the different threads if you found any issue in one of the thread executions. For both these requirements the debug window provides options to switch between threads and get thread dump.
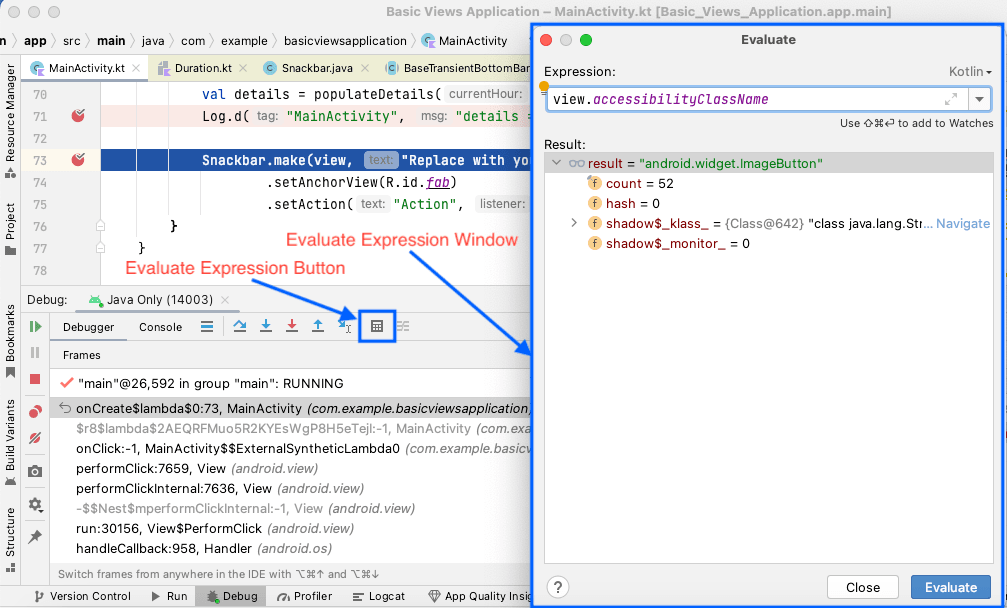
Evaluating expressions
Watches are useful to keep track of specific expressions or objects for a long run path. But if your requirement is to evaluate the expression just for the current use case, then use “evaluate expressions” functionality. With “evaluate expressions”, you can freely analyze the result of complex expressions and multi-line code which will give the evaluation when you run it.
Smart Step Into

We would already know about Step into option, which helps to take you inside a method present on the current execution line. But there are often times when a single line has multiple methods inline (think chained factory methods), which is where “Smart Step Into” comes into play.
To use this option, follow below steps:
- Go to the Android studio “Run” menu option.
- Select “Debugging options -> Smart Step Into” option.
- Click on the method which you want to step into from the line.
Force run to cursor
“Force run to cursor” will ignore all the breakpoints between the current execution point and the current cursor line and pauses on the cursor line.
This is especially useful when there are hundreds of breakpoints in your code, which happens often, but you want the debugger to continue execution until the current code cursor point is executed.
To use this option, go to “Run -> Debugging options -> Force run to cursor”.
Reset frame
This is a fancy option — but do use with diligence.
Say you mistakenly stepped too far or wanted to re-enter into a method where you missed to debug some critical code block. If you didn’t know about “Reset Frame”, you would start the debugging session again to debug the missed method. Rebuilding and debugging each time when you miss the method can be time consuming.
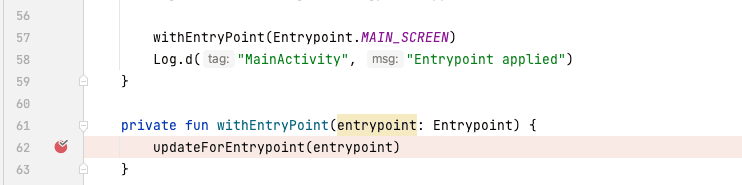
By using the “Reset frame” option, it helps to undo the last frame and restore the previous frame in the stack.
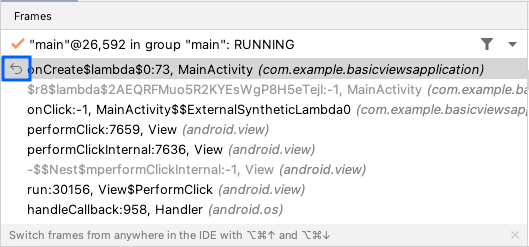
In the below example, the reset frame will take you back to line 57 as if “withEntryPoint()” were never called.
Note, the changes that were made to the global states will not get reverted when you reset the frame, only local states will be reverted. Means, if “withEntryPoint()” updates any global state and then you reset the frame, then the global state updates will not get reverted which could lead to some weird behavior or crashes. So be aware when using this option!
Wrapping up
Debugging is hard. A lot of times knowing the right tools helps you think and approach a problem in the right direction. We hope the above features of customized breakpoints and the debug window will help you fix those hard problems. There are multiple other features in Android debugger like “Tracing current stream chain”, Force returning from method or throw exception from method, Force step into/over which, although we did not cover here, have great use cases as well. Do check them out on JetBrains documentation and official Android documentation.
Thank you for reading!